exc-653be08a9e677e11140c4062
The NASDAQ futures have shown significant momentum, with an increase of 110 points. This article aims to provide a detailed analysis of the NASDAQ market using the Elliott Wave theory. By examining various targets and indicators, we can gain insights into potential price movements and market trends.
Elliott Wave Analysis
The Elliott Wave theory, developed by Ralph Nelson Elliott in the 1930s, suggests that market price movements follow a specific wave pattern. These waves consist of impulsive waves (trending upward) and corrective waves (trending downward). Understanding these waves can help predict future market behavior.
Current NASDAQ Situation
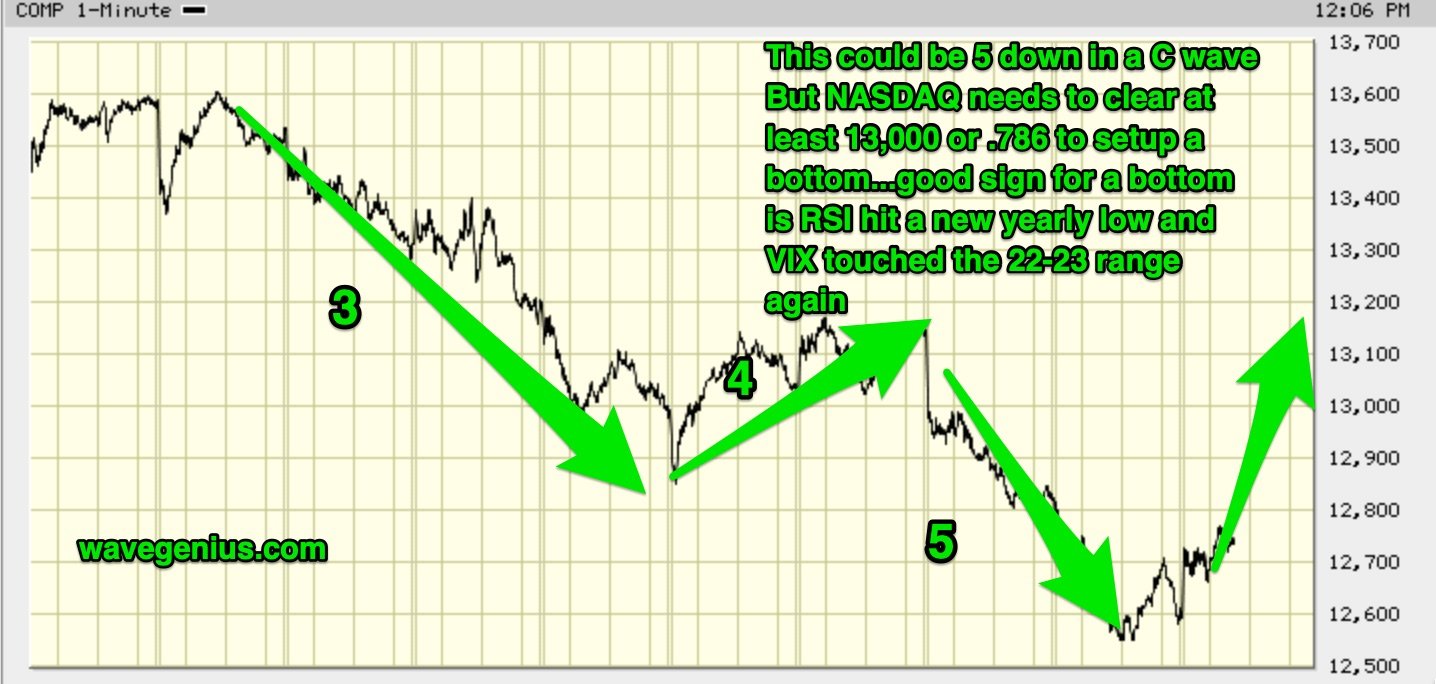
Currently, the NASDAQ is approaching a critical level of 13,340. If this level is cleared, two potential targets can be identified based on the Elliott Wave theory:
Target 1: If the current wave represents an ABC correction, the NASDAQ could potentially reach 13,560 if wave A equals wave C.
Target 2: In the case of an upward W3 wave, the NASDAQ could potentially reach as high as 13,750-13,800. This level would be close to a .786 retracement and could serve as a bottom if the market forms an upward W3 wave and breaks 13,950.
Indicators
Several indicators support the potential for a bottom in the NASDAQ market. Firstly, there was a significant spike in the VIX, reaching 67% from the lows. Additionally, the RSI reached lows previously set earlier this year. These indicators suggest the possibility of a reversal in the market.


